This Land, Oregon
by William G. Robbins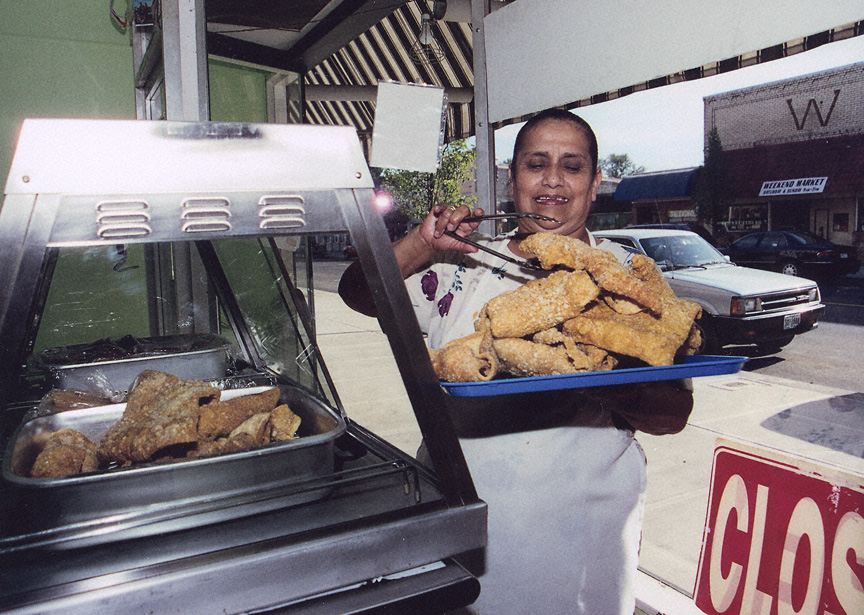
Growing Diversity
Oregon’s ethnic makeup has become increasingly diverse since 1940, especially since 1960. The state was on the receiving end of the remarkable African American diaspora to defense-industry jobs on the West Coast during World War II, increasing from 0.2 percent in 1940 to more than 1 percent in 1960 and to 1.6 percent in 1990. The 2010 census enumerated 1.8 percent as “Black or African American,” with another 2.6 percent of the population listing both African American and one other group identity.
In 2010, Native American and Alaska Native residents comprised 1.4 percent of the population, with 2.9 percent reporting Native and one other racial identity. People with Asian ancestry comprised 0.6 percent of the state's population in 1940, 0.5 percent in 1960, and then increased sharply to 2.4 percent in 1990. The 2010 census lists 3.7 percent of the population as Asian in a broad category that includes Asian Indian, Filipino, Chinese, Japanese, Korean, Vietnamese, and “other Asian.” Another 4.9 percent of Oregon's population identified themselves as Asian and one other category.
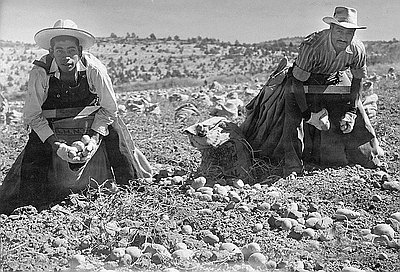
Among the state’s ethnic groups, Oregon’s Hispanic population has shown the most striking growth since World War II. Mexican American immigrants began coming to the Northwest to work as agricultural fieldhands, especially in Idaho and eastern Washington, early in the twentieth century, and their numbers have grown with each passing decade as former migrants became permanent residents and citizens. During World War II, the Bracero labor program brought large number of Mexican agricultural laborers to work in the fields and food-processing plants in Oregon and other northwestern states. After the war, families from the Southwest and northern Mexico flocked to the region in search of work. According to the 1970 census, Hispanics comprised 1.9 percent of Oregon and Washington's population, a number that increased to 2.7 percent in 1980, making them the largest minority group in the two states.
The number of Hispanics had increased to 8 percent of Oregon’s population by 2000, which suggests that their political influence was also growing. Based on the 2000 census, the secretary of state’s office created a newly redistricted state legislative seat that covers the area between Salem and Woodburn, where many Hispanics live. By 2010, the number of Hispanics in Oregon had increased to 11.7 percent.
While Oregon’s population has historically been a largely Caucasian one, the new immigrant groups moving to the state since 1940 have considerably enriched its ethnic makeup. Overall, the immigration of new ethnic groups to Oregon has increased its minority population from 3.6 percent in 1960 to 16.4 percent in 2010.
© William G. Robbins, 2002. Updated and revised by OE Staff, 2014.